
Ricardian Model
ECES905205 pertemuan 2
I Made Krisna Gupta
5 September 2022
Today
- Comparative advantage
- Ricardian model sebagai pondasi trade theory
Konsep Comparative Advantage
Indonesia adalah negara agraris. Kenapa impor kedelai?
- “… (profit menanam kedelai) jauh di bawah keuntungan yang didapat dari menanam padi dan jagung.” (kompas)
Sementara itu, “Indonesian consumers have developed a preference for U.S. soybeans due in part to their uniform size, color and suitability for tempeh and tofu manufacturing.” (ussoy.org)
tempe menjadi produk ekspor andalan di Jepang dan Amerika Serikat
what does it tell you about the structure of the Indonesian economy?
what does it tell you about comparative advantage?
Ekonomi dengan 1 faktor produksi
1 faktor produksi: buruh.
2 barang: Apel dan Beras.
Teknologi direpresentasikan dengan unit labor requirement
- berapa jumlah jam kerja yang diperlukan untuk menghasilkan 1 unit barang.
- cara ini kebalikan dari tipikal produktivitas: angka besar berarti inefisien.
- \(a_{A}\) untuk apel, \(a_{B}\) untuk beras.
Ekonomi dengan 1 faktor produksi
Total labour supply \(= L\)
\(a_{A}Q_A =\) total jam kerja yang diperlukan untuk menghasilkan apel sebanyak \(Q_A\)
\(a_{B}Q_B =\) total jam kerja yang diperlukan untuk menghasilkan beras sebanyak \(Q_B\)
Production constraint:
\[ a_{A}Q_A + a_{B}Q_B \leq L \]
PPF
- Bayangkan sebuah negara (sebut saja H):
- Butuh 1 OJ untuk membuat apel, 2 OJ untuk membuat beras.
- Total OJ di negara H adalah 1.000 OJ \((L=1000)\)
- Jika semua OJ digunakan untuk apel, maka \(A,B=\{1000,0\}\)
- Jika semua OJ digunakan untuk beras, maka \(A,B=\{0,500\}\)
- Linear PPF \(\Rightarrow\) opportunity cost konstan.
- Memutuskan bikin beras 1kg = memutuskan gak bikin apel 2kg.
- Memutuskan bikin apel 1kg = memutuskan gak bikin beras \(\frac{1}{2}\)kg.
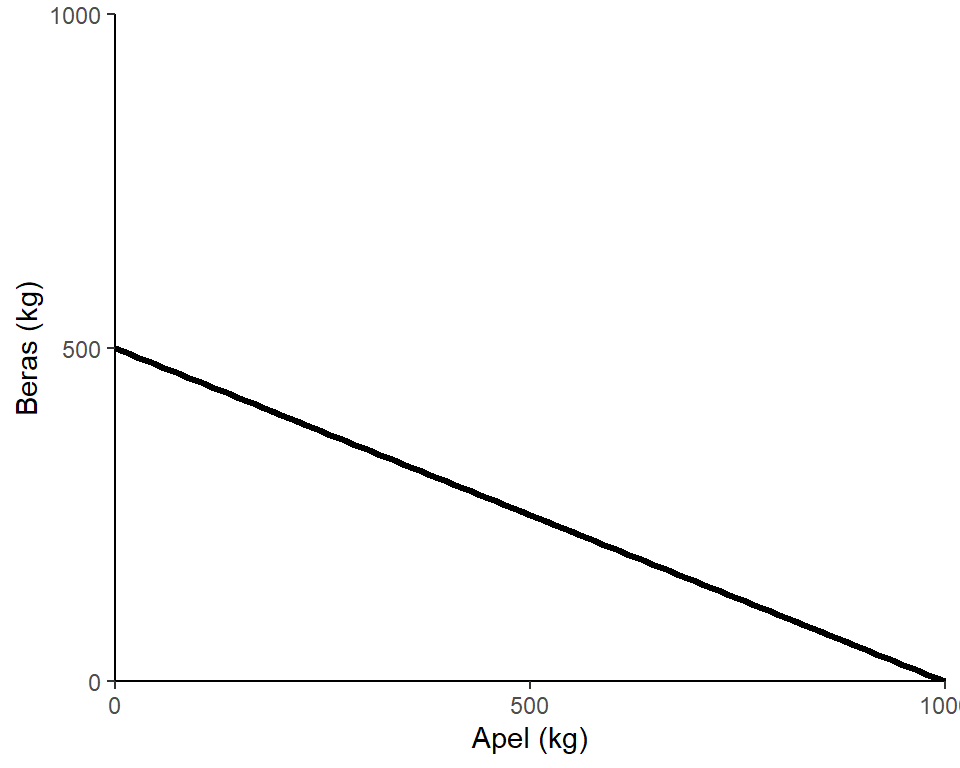
\[ 1Q_A + 2Q_B \leq 1000 \]
PPF and Relative Prices
A simple labor theory of value:
In the absence of international trade, the relative prices of goods are equal to their relative unit labor requirements.
- if \(P_A=P_B\), better concentrate on making A:
- wage \(={1000\times P_A} \geq 500 \times P_B\)
- workers are better off making B only if \(P_A < \frac{1}{2}P_B\)
- workers only produce both iff \(P_A = \frac{1}{2}P_B\)
- equilibrium is at \(\frac{a_A}{a_B}=\frac{P_A}{P_B}\)
PPF and Trade
To understand this term better, we will use some simplified hypothetical examples.
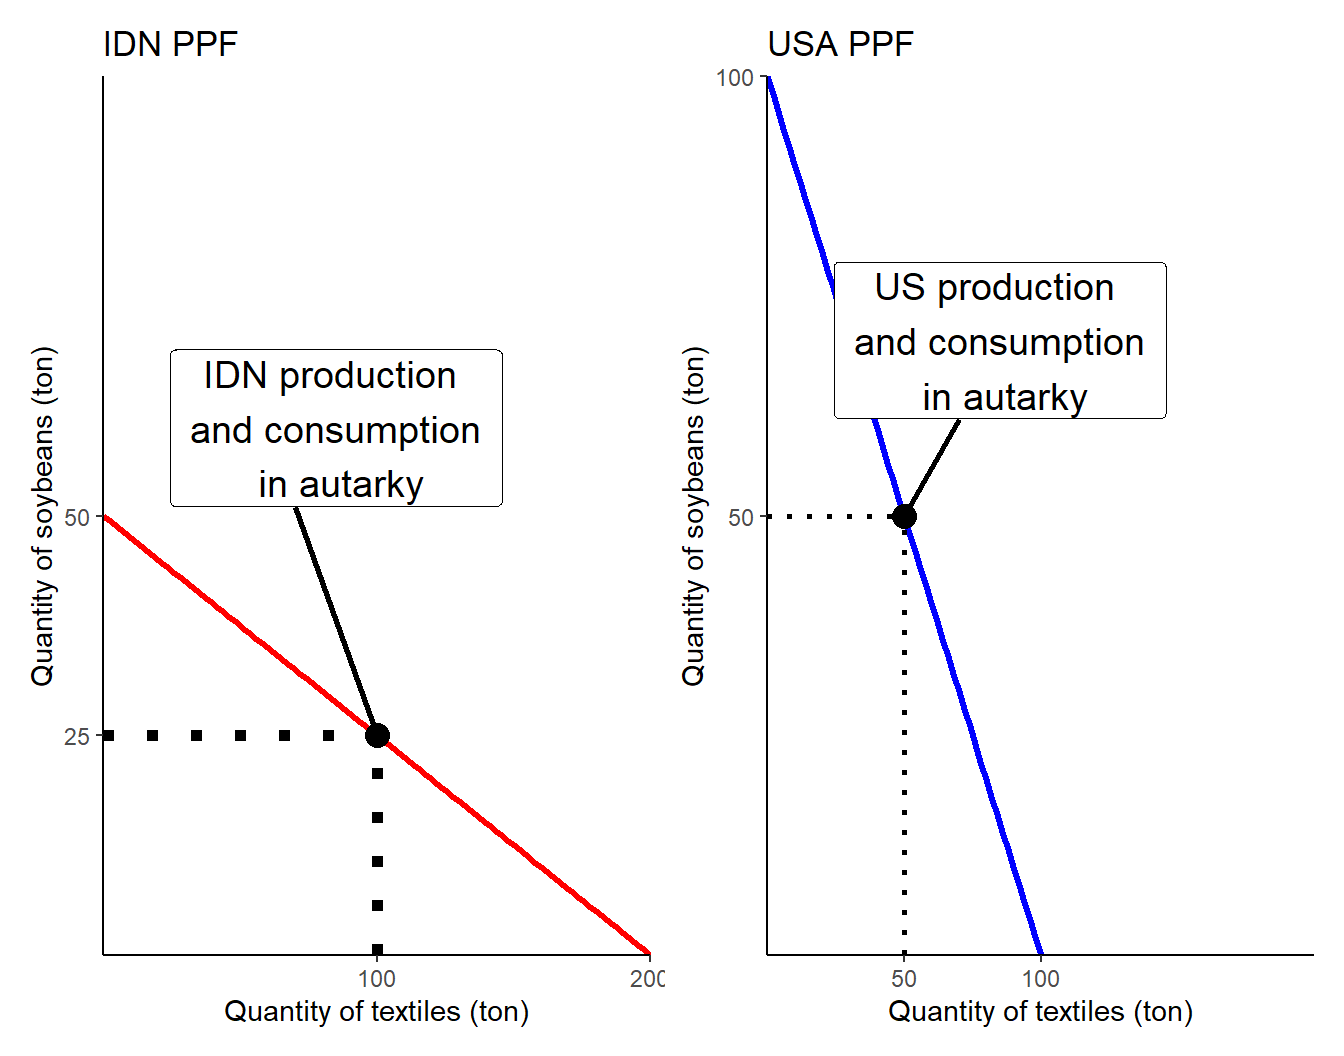
Suppose there are two economies, IDN and USA, and two goods, textiles (T) and soybean (S).
2 countries in autarky
\[\begin{equation} \label{eq2} \begin{split} IDN: \ 1T+4S&=200 \\ USA: \ 2T+2S & = 200 \end{split} \end{equation}\]| Produce | US opportunity cost | IDN opportunity cost |
|---|---|---|
| 1 ton of textiles | 1 ton of soybean | 250 kg of soybean |
| 1 ton of soybean | 1 ton of textiles | 4 ton of soybean |
- IDN is comparatively better at making textiles, while US is better at producing soybean:
- To make 1 ton of textiles, US needs to gave up resources which can be used to make 1 ton soybean, while Indonesians need only to give up 250 kg soybean.
- To make 1 ton of soybean, US needs to gave up resources which can be used to make 1 ton textiles, while Indonesians need only to give up 4 ton of textiles.
- Note:
\[ \frac{a_{it}}{a_{is}}=\frac{1}{4} \geq \frac{1}{1}=\frac{a_{ut}}{a_{us}} \]
Suppose the two countries do not trade. Indonesia’s production is {T,S}={100,25}, While in the US, it’s {50,50}.
Gains from trade
in autarky |
with trade |
|||||
|---|---|---|---|---|---|---|
| production | consumption | production | consumption | Gains from trade | ||
| USA | textiles (ton) | 50 | 50 | 0 | 75.0 | +25 |
| USA | soybean (ton) | 50 | 50 | 100 | 62.5 | +12.5 |
| IDN | textiles (ton) | 100 | 100 | 200 | 125.0 | +25 |
| IDN | soybean (ton) | 25 | 25 | 0 | 37.5 | +12.5 |
By concentrating production on one good and then trade, you can see that both ended up better-off:
with autarky, total production {textiles,soybean} \(=\{150,75\}\)
consumption=production, and \(C_{USA} = \{50,50\},C_{IDN} = \{100,25\}\)
Gains from trade
in autarky |
with trade |
|||||
|---|---|---|---|---|---|---|
| production | consumption | production | consumption | Gains from trade | ||
| USA | textiles (ton) | 50 | 50 | 0 | 75.0 | +25 |
| USA | soybean (ton) | 50 | 50 | 100 | 62.5 | +12.5 |
| IDN | textiles (ton) | 100 | 100 | 200 | 125.0 | +25 |
| IDN | soybean (ton) | 25 | 25 | 0 | 37.5 | +12.5 |
with trade, total production {textiles,soybean} \(=\{200,100\}\)
- Production \(\Rightarrow Q_{USA}=\{0,100\}, Q_{IDN}=\{200,0\}\)
- Consumption \(\Rightarrow C_{USA}=\{75,62.5\}, C_{IDN}=\{125,37.5\}\)

Comparative advantage
In reality, we will need country’s preferences to establish proper equilibrium quantity and prices.
In this model, we have no price. But from the opportunity cost, we can calculate the relative prices:
- In the US, opportunity cost to produce 1 soybean is 1 textile. That means, \(P^{soybean}_{USA} = P^{textile}_{USA}\)
- In IDN, opportunity cost to make 1 soybean is 4 textiles. That means, the price of soybean must be four times price of textile.
Comparative advantage
Note that in autarky, both countries consume (and produce) with the same proportion as their unit labor cost.
With trade, both countries produce with 1:2 proportion
- their consumptions are skewed toward 1:2
This reflects the change in relative prices:
- with trade, textile gets relatively cheaper in US.
- in IDN, soybean gets a bit cheaper (from 1:4 to around 1:3.33)
Comparative VS Absolute advantage
- It’s possible that a country is good at producing many things.
- This is called absolute advantage.
- There’s no reason why US can’t be better at making clothes than Indonesia.
- Hence, it’s possible that in fact, US still better at making clothes
- But what matters is relative opportunity cost:
- as long as its better for US capital and labour to produce soybean, they will still buy clothes from Indonesia.
- It may take lots of labor to produce textiles in Indonesia, but it’ll take even more to produce soybean.
- Makin specialised, makin besar opportunity cost.
- S2 UI vs SMEA.
Absolute advantage
- Suppose USA dominates IDN in both:
Autarky: \(Q_{USA}=\{50,50\}, Q_{IDN}=\{40,25\}\)
Trade: \(Q_{USA}=\{10,90\}, Q_{IDN}=\{80,0\}\)
Total: \(Q_{autarky}=\{90,75\}, Q_{trade}=\{90,90\}\)
A note on absolute advantage
Mungkin anda menyadari bahwa absolute advantage hanyalah versi alternatif dari Walras Law.
Dengan kata lain, meski ada keunggulan absolut, contract curve & better allocation tetap ada (hence pareto improvement).
- Meski demikian, negara yang punya keunggulan absolut tetap memiliki posisi tawar yang lebih baik.
trade is pareto improving in the sense that we compare country A before trade with country A after trade.
- we do not compare country A with country B.
Taking from the poor?
In short, because IDNsians are less productive compared to the US, it’s better to US to buy cheaper goods to IDN.
This is not to say that US take advantage from IDN:
- Since IDN labour is less productive anyway, they will still have low wage even if they sell domestically.
- In fact, serving US market may give them higher wage.
For example, if you feel ordering go-food is taking advantage from tukang ojeg, the alternative is even worse:
- if you ended up stop ordering go-food, their income is gone.
What determines comparative advantage?
Differences in climate is the reason why we’re so good at producing CPO and rubber, but sucks at producing soybean and wheat.
Differences in Factor Endowment. Some countries are endowed with natural resource, some with cheap labour. Countries which has no both has to find something else, such as:
Differences in technology. Japan, South Korea and Taiwan are one good example. While technology can be transferred, opportunity cost of investing in high-tech things is more production of CPOs.
Trade is Good
Barusan kita mempelajari bahwa ada gains dari trade bahkan ketika trading partner punya absolute advantage atas semua produksi.
Jika tidak ada pun, autarky akan terjadi tanpa dipasang penghalang / barier
- ini gak papa jika autarky terjadi tanpa pemaksaan.
Untuk analisis yang menyeluruh, kita perlu memperhitungkan preference
- preference dapat direfleksikan dengan harga.
- namun intuisinya tidak berbeda jauh.
- kita bahas di pertemuan-pertemuan berikutnya.
Multi-goods comparative advantage
Misalnya ada N goods.
unit labor cost di home jadi \(a_i\) di mana \(i \in (1,N), N>2\)
- correspondingly, \(a_i^*\) adalah untuk foreign
untuk setiap good \(i\), kita buat \(\frac{a_i}{a_i^*}\)
lalu urutkan sehingga \(\frac{a_1}{a_1^*} < \frac{a_2}{a_2^*} < ... < \frac{a_N}{a_N^*}\)
- alias diurutkan berdasarkan comparative advantage.
Multi-goods comparative advantage
- Let \(w\) be home wage per OJ, while \(w^*\) be foreign wage.
- artinya, biaya membuat 1 apel di home \(= wa_{apel}\)
- biaya membuat 1 apel di foreign \(= w^*a_{apel}^*\)
- Goods are produced in the cheapest place.
- Apel dibikin di home jika: \(wa_{apel}<w^*a_{apel}^*\)
- atau jika: \(\frac{a_{apel}^*}{a_{apel}}>\frac{w}{w^*}\)
Multi-goods comparative advantage
- Let 2 economies with this characteristics:
| Good \((i)\) | \(a_i\) | \(a_i^*\) | \(\frac{a_i^*}{a_i}\) |
|---|---|---|---|
| Apel | 1 | 10 | 10 |
| Beras | 5 | 40 | 8 |
| CPO | 3 | 12 | 4 |
| Durian | 6 | 12 | 2 |
| Emas | 12 | 9 | 0.75 |
Note that table above is sorted decendingly by \(\frac{a^*_i}{a_i}\)
or: \(\frac{a_1}{a_1^*} < \frac{a_2}{a_2^*} < ... < \frac{a_5}{a_5^*}\)
Multi-goods comparative advantage
| Good \((i)\) | \(a_i\) | \(a_i^*\) | \(\frac{a_i^*}{a_i}\) |
|---|---|---|---|
| Apel | 1 | 10 | 10 |
| Beras | 5 | 40 | 8 |
| CPO | 3 | 12 | 4 |
| Durian | 6 | 12 | 2 |
| Emas | 12 | 9 | 0.75 |
Ingat: dibikin di home jika: \(\frac{a_{i}^*}{a_{i}}>\frac{w}{w^*}\)
say \(\frac{w}{w^*}=\frac{12}{4}=3\)
Maka apel, beras dan CPO akan dibuat domestik.
Durian dan Emas diimpor.
How useful?
- Relative productivity dan relative wage merupakan poin analisis yang sangat intuitif.
- gets complicated very soon as we add countries and factors.
- tastes, economic structures, etc
- but the intuition is very similar.
- Namun jika analisis ini benar, berarti negara-negara akan auto-spesialisasi? Apakah ini yang kita observe di dunia nyata?
What prevents specialisation?
- More than 1 factors
- Protectionisms.
- Transportation cost.
- Some places are inherently difficult to reach.
- Some goods are harder to move.
- at the extreme, a good can be nontradable good.
- most services are like this.
What prevents specialisation?
Ricardian model: 1 very mobile factor of production.
In reality, trade matters in distribution of income.
- short-run: moving factors are costly.
- long-run: shift in factor demand.
Factor owners (land, labor, capital, etc) receive different gains from trade!
Japanese rice farmer case:
- Land scarcity -> rice is expensive (even compared to US).
- Free trade means higher real wage.
- Farmers may need to move industries.
- reskilling is costly.
- land value drops.
- machines & infrastructure become useless.
- Better spend money to organize politically!
Specific factors
Next, we add one more factor to the model: a specific factor.
Labor can move between sectors, but this one other factor is specific to the sector, hence can’t move freely.
- just like our Japanese farmers!
We will also discuss a bit what is this specific factor of production in reality.